|
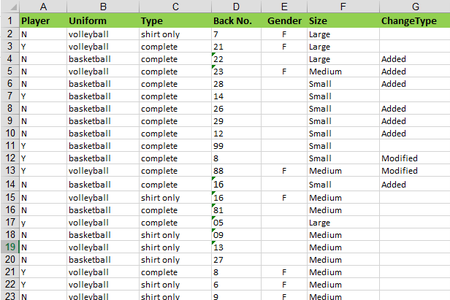
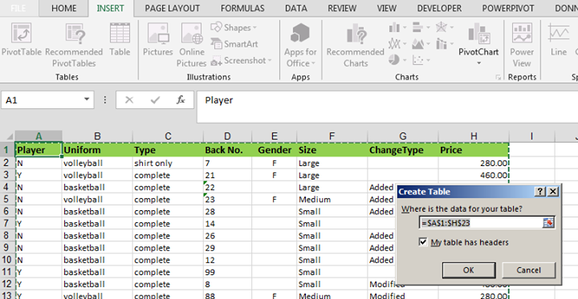
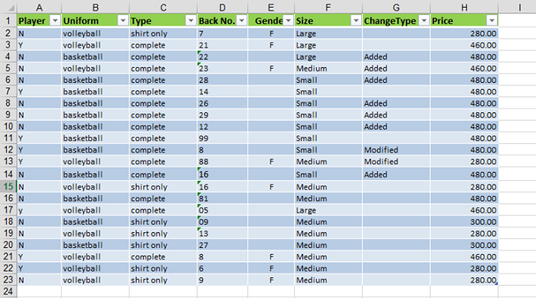
[Excel 2007 onwards] If you create a data like below, and ask someone if this is a table, 95% would say it is. But in Excel's world, this is just a range. A range is any data setup either in row, column, or table- like. A table or data table in Excel is defined differently and has to be declared. To create a table, you need to setup something like the table or a range. Once done, we need to declare that this range of cells is a table by going to Insert > Table. (This is available in 2003, under the Data dropdown.) A small window will appear and you can enter the range of cells that will be declared a table. If you have selected one cell of the range or the entire range, then, this should be filled out automatically. Click OK and your data range will transform to a data table, which is shown by default to have horizontal bars and drop downs if it does not have yet. Note that it will not override any previous cell formatting you may have added. You can change the formattings of your data table by clicking any cell and going to the Table Tools > Design tab, a context ribbon that will show up.
One nice feature of the data table is that when it is a large one and you have to scroll, you do not have to freeze the panes to maintain visibility of the headers. When you were declaring the range as a table, and you checked the box that says "My Table has Headers," the first row of the table will be the headers, and they will replace the letters of the heading (the A, B, C, D, etc above the worksheet) when you scroll down. More features of the data table will be explored in the next entries. |
Archives
April 2020
Categories |


 RSS Feed